Liquidity Sweep vs Liquidity Run: How to Read Direction
A liquidity sweep is when price trades through an obvious high or low, triggers the orders resting there, and then closes back inside the level. A liquidity run is when price breaks the level and keeps going, closing and holding beyond it. A sweep often points to a reversal. A run points to continuation. In both cases, the candle close tells you which one you're looking at.
This guide covers the closing rule, which levels are worth watching, how to use a sweep to choose a direction for the day, and how to time an entry after the sweep instead of guessing it.
What is a liquidity sweep?
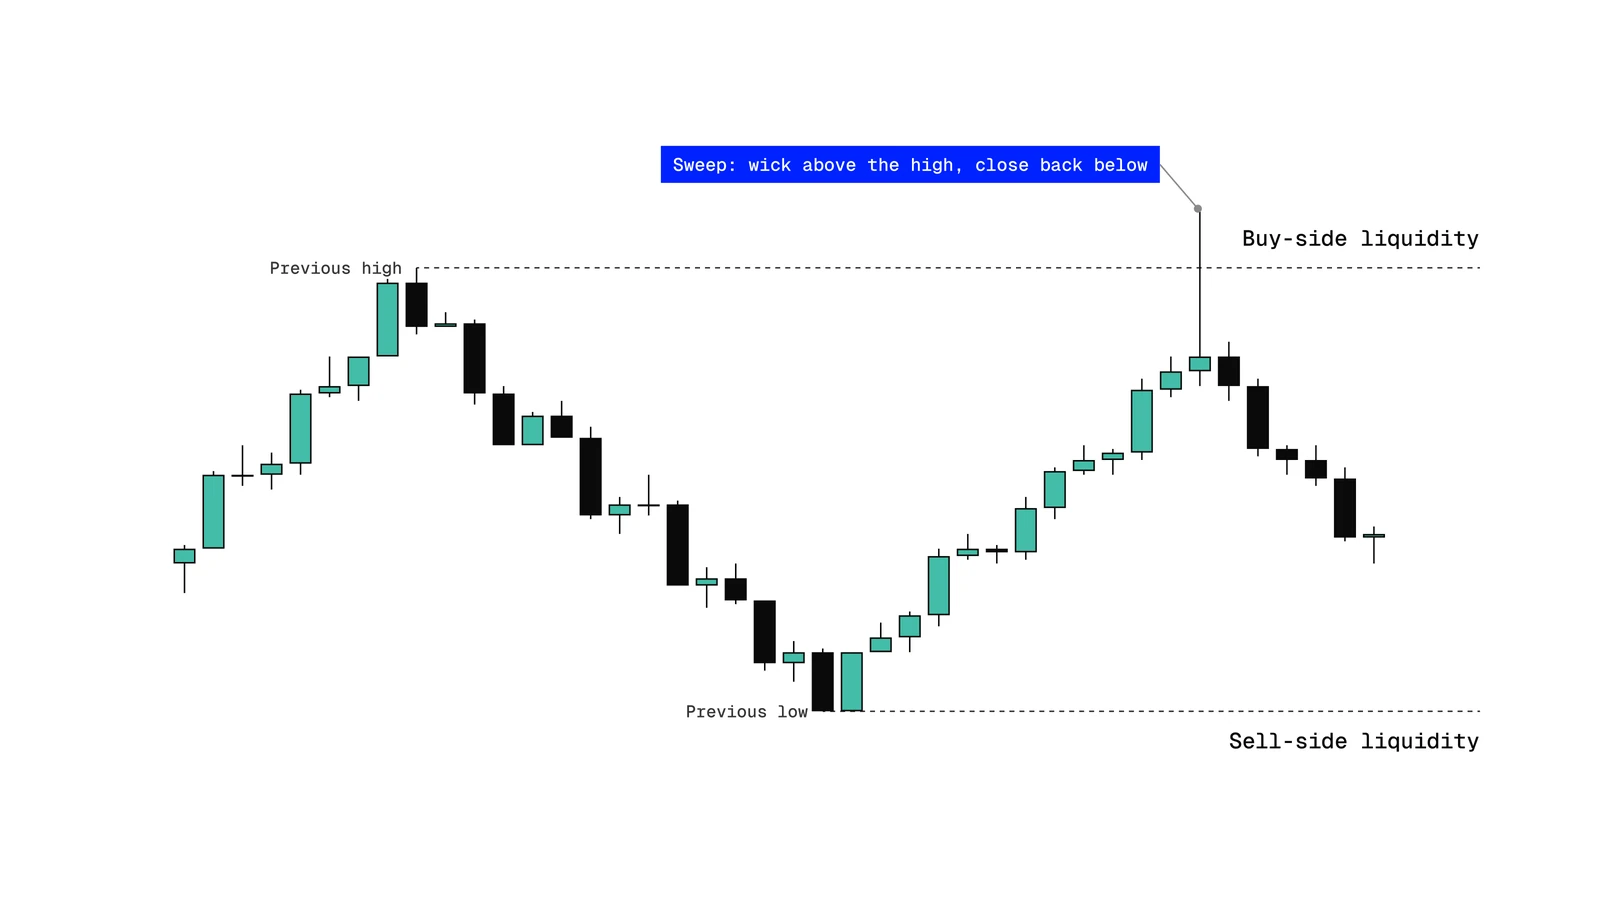
Liquidity is where orders are waiting. Above a previous high sit the stop losses of traders who are short and the buy orders of breakout traders: that's buy-side liquidity. Below a previous low sit the stops of traders who are long and the sell orders of breakout traders: that's sell-side liquidity.
Price tends to move toward these obvious levels, because that's where enough orders exist to fill large positions. A liquidity sweep happens when price pushes just beyond one of these levels, fills those resting orders, and then fails to continue. Once the liquidity on one side has been used up, the next obvious target is often the liquidity on the other side.
That's why a sweep is so useful. It tells you which side of the market was just cleared and, by extension, which side price is likely to go after next.
Here's a simple liquidity sweep example:
Sweep vs run: the closing rule
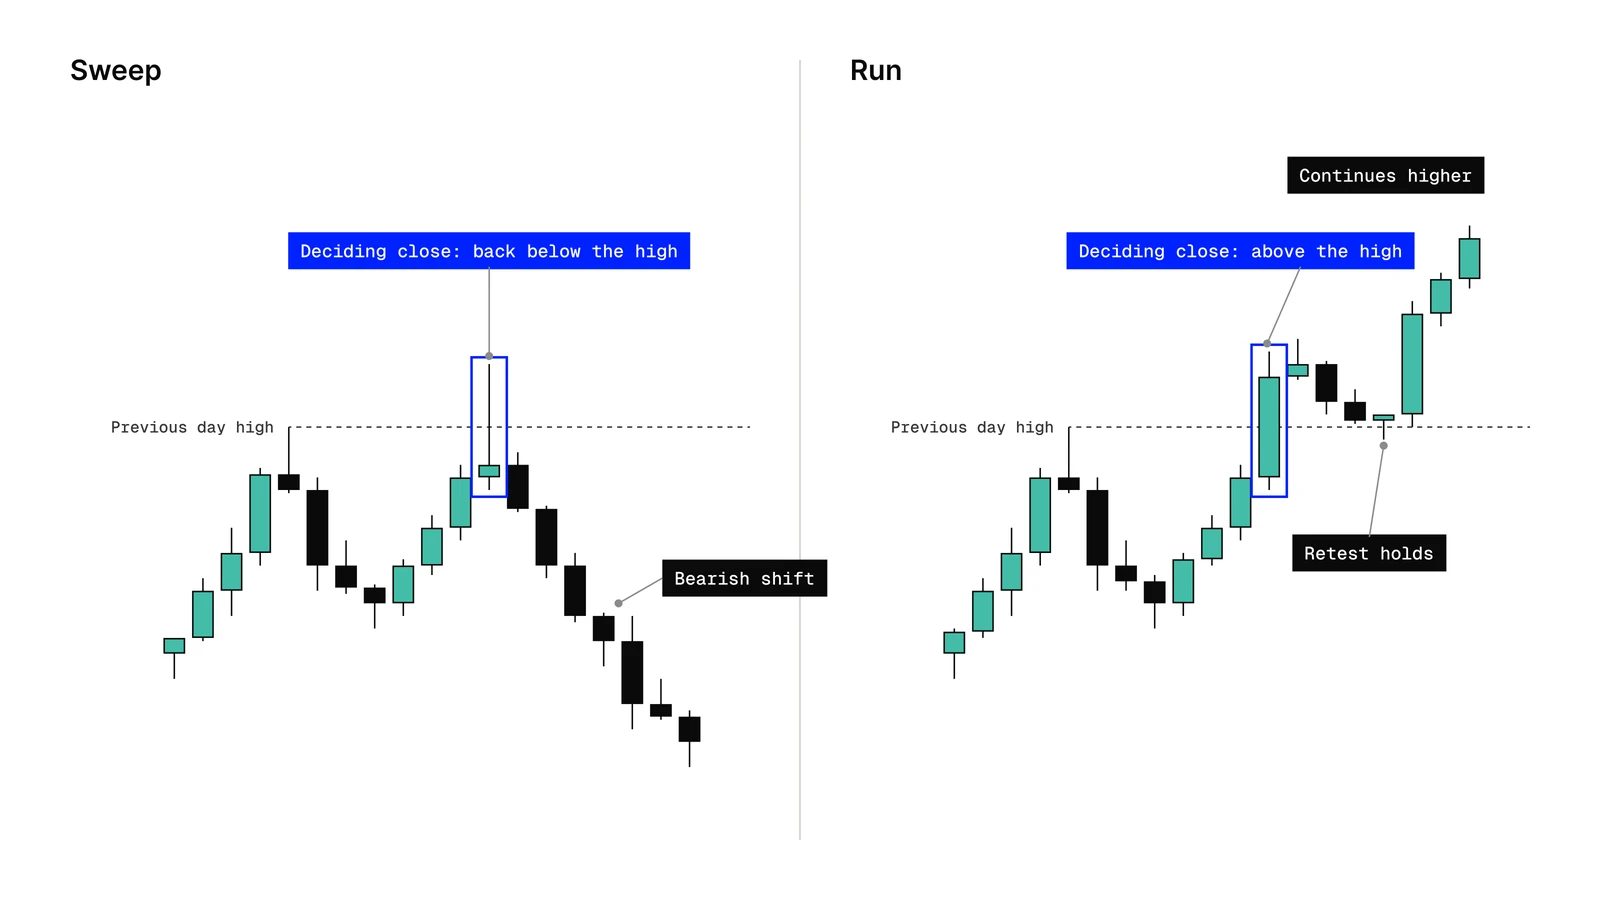
Wicks don't decide it. Closes do.
- Sweep: price trades beyond the level, but the candle closes back on the original side. The breakout failed, and the orders beyond the level were filled into a reversal.
- Run: price trades beyond the level and the candle closes beyond it. Price then keeps going or holds above (or below) the level. The liquidity fueled a continuation.
Judge the close on the timeframe the level belongs to. A previous day high is judged differently from a 1-minute swing high. A 1-minute candle closing above the previous day high says very little. Several closes and acceptance above it say much more.
| Liquidity sweep | Liquidity run | |
|---|---|---|
| What price does | Trades beyond the level, then fails | Breaks the level and continues |
| The close | Back inside the level | Beyond the level, and holds there |
| What it suggests | Reversal: price goes after the opposite side | Continuation: price goes after the next level in the same direction |
| What to look for next | A shift back through the structure (breaker) and a reversal entry | A pullback and a continuation entry in the direction of the run |
| Common mistake | Calling it a sweep while the candle is still open | Fading it as a "sweep" when price is already closing and holding beyond the level |
A sweep doesn't guarantee a reversal. Sometimes price closes back inside, pauses, and then breaks through anyway. That's why the sweep only sets the context. The entry still needs confirmation.
Liquidity sweep vs liquidity grab: same thing?
In practice, yes. "Liquidity grab", "liquidity raid" and "stop hunt" all describe the same event: price reaching beyond an obvious level to trigger the orders there before reversing. Some traders use "grab" for a fast single-candle wick and "sweep" for a move that trades beyond the level over a few candles, but the logic and the rule are identical. What matters is the close.
Which liquidity matters
Not every high and low is worth watching. The more obvious the level, and the higher the timeframe it belongs to, the more orders tend to rest there.
Session highs and lows
Each trading session leaves a high and a low. The Asia session usually ranges and builds liquidity on both sides, and the London session often runs one of them. Session highs and lows are common targets around the next session open, especially New York. A sweep of the Asia or London high or low into the New York open is one of the setups the model watches most closely.
Previous day / week highs and lows
When a new daily or weekly candle opens, price often takes the previous candle's high or low first and then moves the other way.
- Open → High → Low → Close (a bearish candle): the new candle makes its high first, often by running the previous candle's high, then reverses and closes near its low. If buy-side liquidity is taken early in the candle, favor shorts on a lower timeframe.
- Open → Low → High → Close (a bullish candle): the new candle makes its low first, often by running the previous candle's low, then reverses and closes near its high. If sell-side liquidity is taken early in the candle, favor longs on a lower timeframe.
To use this, mark the previous candle's high and low and watch which one price takes first after the open.
Swing highs and lows
A swing high is a point where price pushed up, rejected and moved lower. A swing low is the opposite. They are obvious reference points, so stops and breakout orders collect around them. Higher-timeframe swings (1-hour, 4-hour, daily) carry the most weight. Equal highs or lows, where price stops at the same level two or more times, are especially obvious and often get taken.
Using the sweep to choose a direction
This is the core idea: you don't predict direction, you read it from what price has already done.
- Mark the levels before the session. Note the previous day high and low, the session highs and lows, and the nearest higher-timeframe swing highs and lows.
- Wait for one side to be taken. Don't trade the approach to the level. Let price reach it.
- Apply the closing rule. Did price close back inside (sweep) or close and hold beyond (run)?
- Pick the side. If the lows were swept, look only for longs. If the highs were swept, look only for shorts. If the level was run, don't fade it.
- Drop to a lower timeframe for the entry. The higher timeframe gives the direction. The lower timeframe gives the execution. Which lower timeframe you use depends on the timeframe of the level that was swept.
- Check the context. A sweep that happens at a higher-timeframe point of interest and inside a session window is worth more than one in the middle of nowhere. See The Unicorn Is a Pattern, Not a Model for the full set of filters.
If both sides get taken in the same session, the direction is no longer clean. It's usually better to step back than to pick one.
How to take an entry after a liquidity sweep
The sweep tells you the direction, but it isn't the entry. Entering on the wick itself means guessing where the reversal ends, with no structure to put a stop behind.
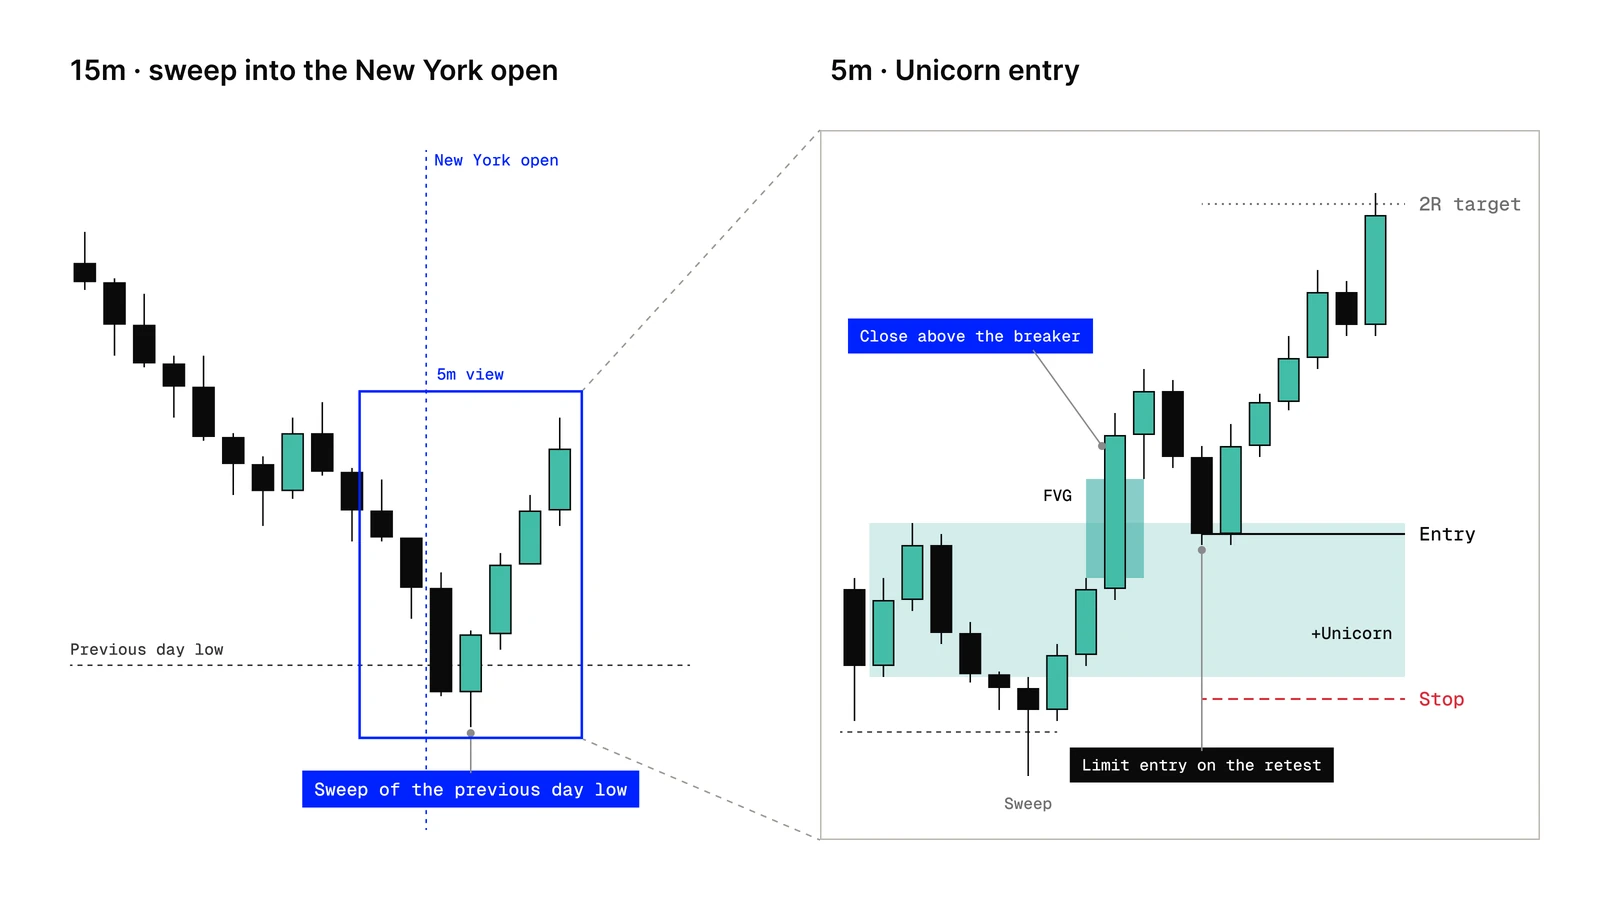
In the Unicorn Model, the trigger after a sweep is the Unicorn:
- Price sweeps a low (for a long).
- Price reverses and closes back above the breaker, the up-closed candle(s) before the move that took the low.
- The displacement leaves a fair value gap that overlaps the breaker.
- After a candle closes to confirm it, you place a limit order for the retest of the overlap.
- The stop goes below the breaker by default, or below the low that swept liquidity if you want room for a wick.
Bearish setups are the mirror image after a sweep of a high. The breaker and FVG mechanics are covered in Unicorn vs Breaker Block, and the entry and stop options in how to set your Unicorn entry and stop loss.
Mistakes
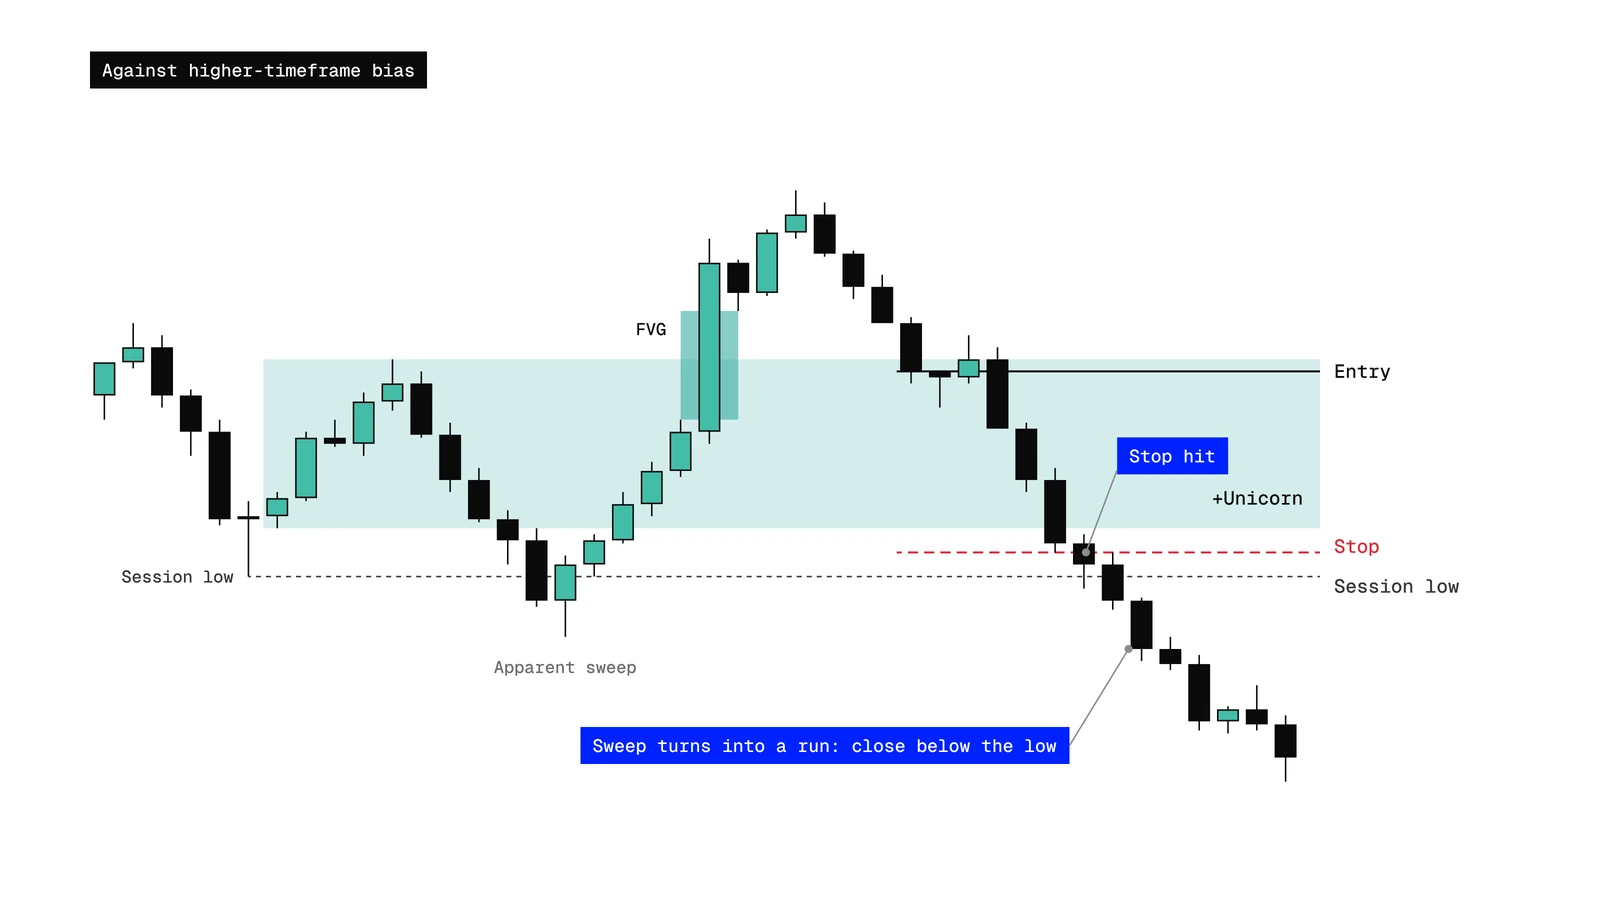
- Trading the sweep against the bias. A sweep of a minor low inside a strong higher-timeframe downtrend is often just a pause. If the higher timeframe disagrees, the sweep is weaker.
- Entering in the wick. Buying while price is still trading below the low means catching a move that may turn into a run. Wait for the close and the shift.
- Calling a run a sweep. If price closes and holds beyond the level, it isn't a failed breakout. Fading it means trading against the move that's actually happening.
- Marking every tiny high and low. On a 1-minute chart there are dozens. Stick to session, daily, weekly and higher-timeframe swing levels.
- Ignoring time. A sweep in the middle of a quiet range is not the same as a sweep at a session open or after news. On high-impact news days, wait for the release before looking for entries.
How the indicator detects sweeps
This article is published by The Unicorn Model, which sells a TradingView indicator for this setup.
The Unicorn Model indicator uses liquidity sweeps as the starting point for every breaker and Unicorn it draws. You choose which liquidity it watches: higher-timeframe candle highs and lows (the previous candle's OHLC), swing highs and lows, and, since the latest update, session liquidity sources so session highs and lows can feed the same logic. With Breaker + Unicorn Mode, you can follow the full sequence on the chart: liquidity sweep, breaker formation, FVG confirmation, then Unicorn.
It marks structure. It doesn't tell you which direction to trade, and it isn't a signal service. See the details in the latest indicator update, or learn the full process in the full Unicorn Model course.
FAQ
What is the meaning of a liquidity sweep?
A liquidity sweep is when price moves just beyond an obvious high or low, triggers the stop and breakout orders resting there, and then closes back inside the level. It shows that one side of the market has been cleared, and price often goes after the other side next.
What is the difference between a liquidity sweep and a liquidity run?
The close. In a sweep, price trades beyond the level but closes back inside it. In a run, price closes beyond the level and holds or continues. A sweep suggests a reversal and a run suggests continuation.
How do you take an entry after a liquidity sweep?
Don't enter on the wick. Wait for price to shift back through the structure, then use an entry pattern with a clear stop. In the Unicorn Model that is a breaker with an overlapping fair value gap, entered on the retest after a confirming close, with the stop beyond the breaker.
Is a liquidity grab the same as a liquidity sweep?
Yes, for practical purposes. "Grab", "raid", "stop hunt" and "sweep" describe price reaching beyond a level to take resting orders before reversing. The same closing rule applies to all of them.
Read the market from what it has already done
Direction is easier to read after a sweep than to predict before one. Start with the full Unicorn Model course to see how liquidity, context and the entry fit together, or see the indicator plans to have sweeps, breakers and Unicorns marked on your chart.
Trading futures and other leveraged products involves substantial risk of loss and is not suitable for every investor. This article is for educational purposes only and is not financial advice. Past performance does not guarantee future results.